What I see
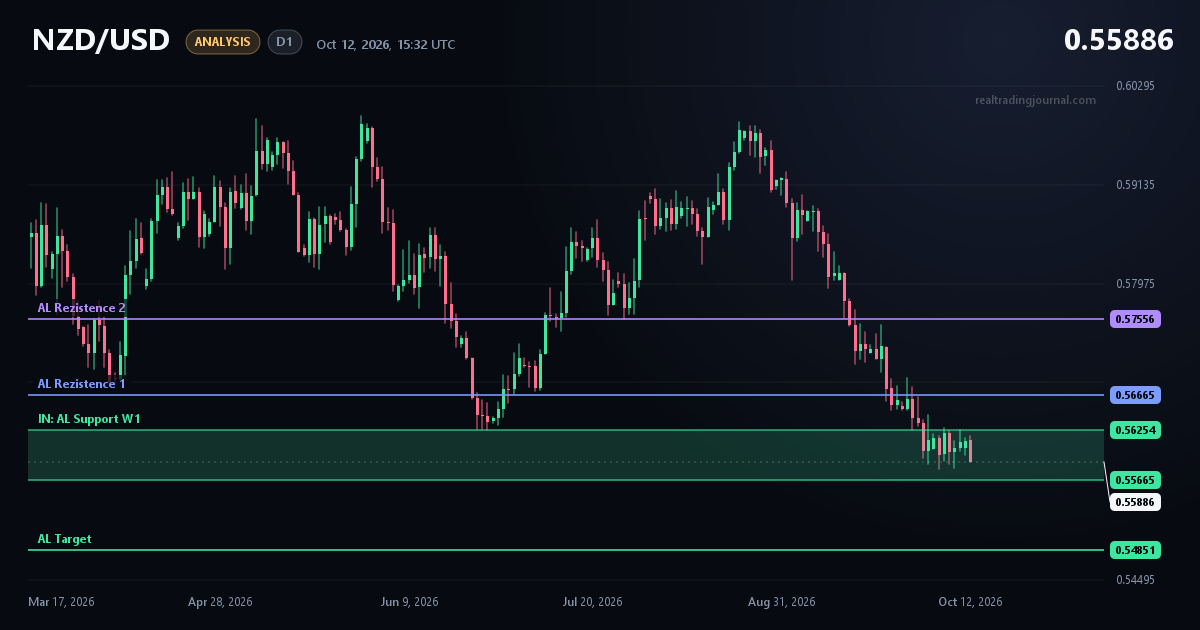
On the daily chart, NZD/USD is testing last year's support, which I have marked as the zone between 0.55665 and 0.56254. The current price of 0.55886 sits inside this zone. The decline from the August highs was sharp, but the latest candles inside the zone have slowed down and are moving in a tight range.
Key levels
- Support: 0.56254 – 0.55665 (last year's zone)
- Resistance 1: 0.56665
- Resistance 2: 0.57556
- Lower target: 0.54851
My plan
For now I am watching how price reacts at the support. If the zone breaks, we will probably look at lower values toward the lower target at 0.54851. If price bounces, I expect a move toward resistance 1 at 0.56665, and possibly as far as resistance 2 at 0.57556.