What I see
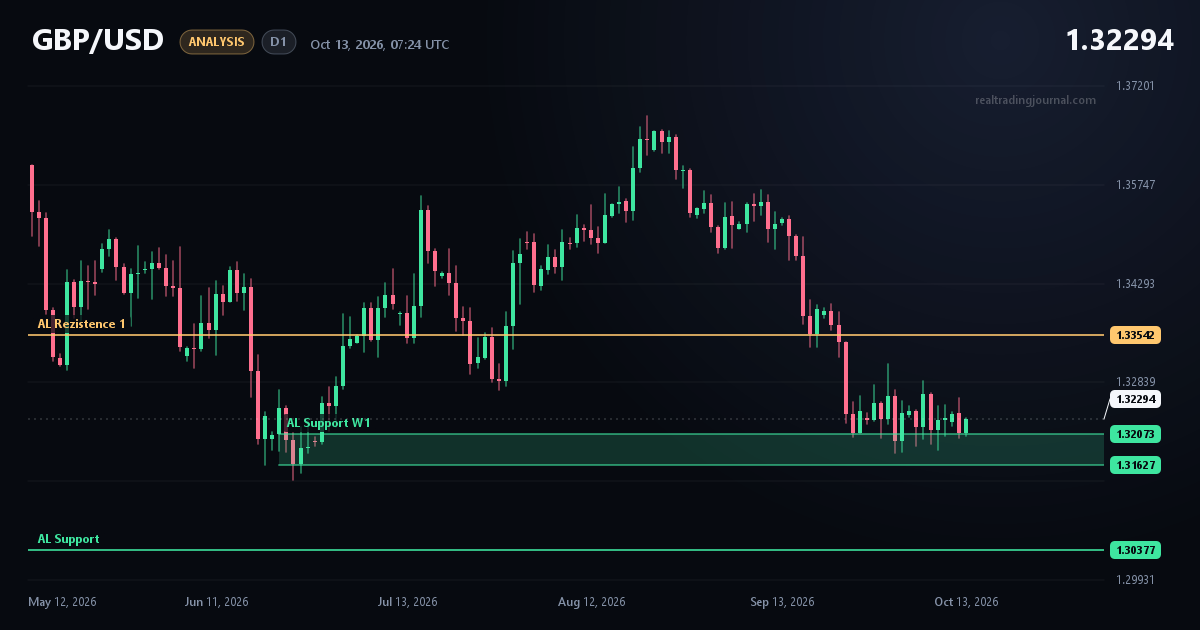
Price is at 1.32294 and, after the decline from the recent highs, is testing the weekly (W1) support zone between 1.32073 and 1.31627. Over the last several candles price has stalled inside or just above this zone, and the market is not yet showing a clear continuation lower.
Key levels
- Support W1: 1.32073–1.31627
- Resistance: 1.33542
- Lower support: 1.30377, which I treat as roughly 1.3000
My plan
We are testing a long-term support on this pair. If the zone holds and price bounces, I expect it will likely move toward the resistance around 1.3350, which is 1.33542.
If the zone breaks, the path opens toward support around 1.3000. In that case I will watch how price reacts at 1.30377.
For now I am waiting for price to react inside the zone rather than getting ahead of it.