← All chart analyses← Všechny analýzy grafů
TECHNICAL ANALYSIS · USD/CHF · D1TECHNICKÁ ANALÝZA · USD/CHF · D1

USD/CHF: Testing the D1 Support Zone at 0.82246–0.81827USD/CHF: test denního supportu 0.82246–0.81827 na D1

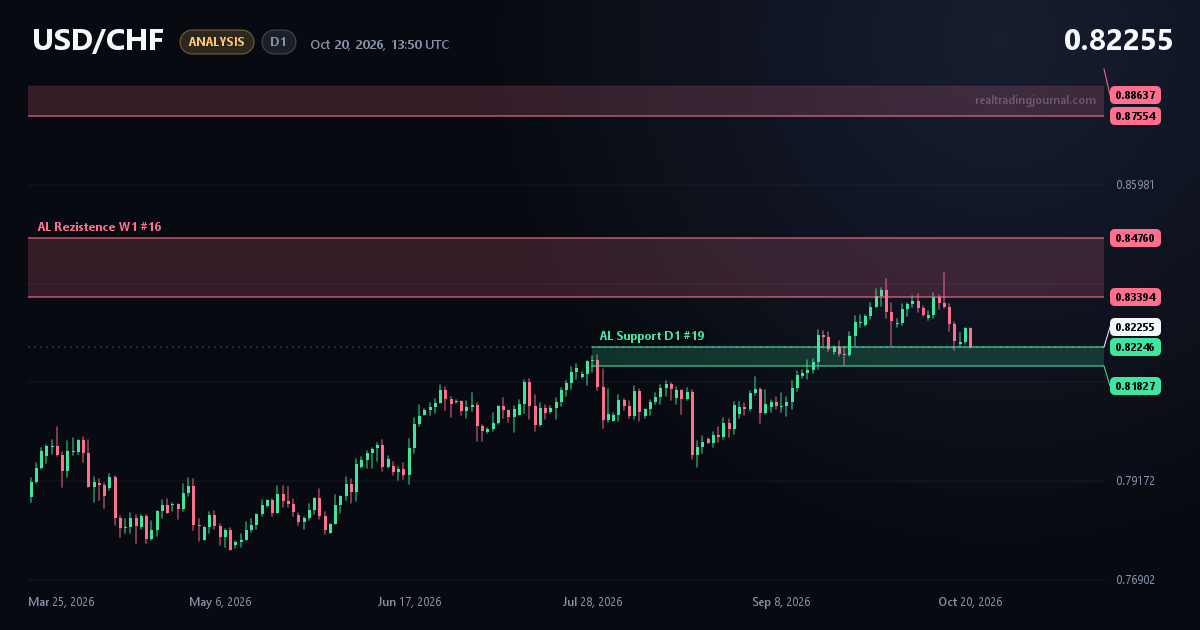
On the daily chart, USD/CHF is testing the support zone at 0.82246–0.81827. The resistance zone at 0.83394–0.84760 sits above price.Na denním grafu USD/CHF testuje cena zónu supportu 0.82246–0.81827. Nad cenou leží rezistenční zóna 0.83394–0.84760.

USD/CHF D1 chart with my markup: Support zone test
USD/CHF · D1 · my chart on Oct 20, 2026 (JForex, Dukascopy feed)můj graf z 20. 10. 2026 (JForex, data Dukascopy)
Watch the 20-second ShortPodívej se na 20sekundový ShortThe same analysis, animated · YouTubeStejná analýza v animaci · YouTube, anglicky
BiasSměrBullishBýčí
Price at publishCena při zveřejnění0.82255
TriggerVstup—
TargetCíl0.83394
InvalidationNeplatnost0.81827
StatusStavActiveAktivní

What I see

On the daily chart, price is testing a support zone. After the rally from the spring lows, price pulled back from the area below resistance and is now trading at the upper edge of D1 support #19, at 0.82255.

Key levels

  • Support D1 #19: 0.82246–0.81827
  • Resistance W1 #16: 0.83394–0.84760
  • Higher W1 resistance: 0.87554–0.88637

My plan

For now this is a test of the zone, not a confirmed signal. If price holds the support and the daily candles show a reaction, I will watch for a possible move back toward the resistance zone at 0.83394–0.84760. If a daily candle closes below 0.81827, I will treat this support as broken and the idea of a bounce as invalid. In that case I will reassess the situation.

Co vidím

Na denním grafu testuje cena zónu supportu. Po růstu od jarních minim se cena vrátila z oblasti pod rezistencí a nyní se pohybuje na horní hraně supportu D1 #19 na 0.82255.

Klíčové úrovně

  • Support D1 #19: 0.82246–0.81827
  • Rezistence W1 #16: 0.83394–0.84760
  • Vyšší rezistence W1: 0.87554–0.88637

Můj plán

Zatím jde o test zóny, ne o potvrzený signál. Pokud se cena v supportu udrží a denní svíčky ukážou reakci, budu sledovat možný návrat směrem k rezistenční zóně 0.83394–0.84760. Pokud denní svíčka uzavře pod 0.81827, považuji tento support za prolomený a scénář návratu vzhůru za neplatný. V tom případě budu situaci přehodnocovat.

This is my personal read of the chart, written before the outcome is known. It is not investment advice.Je to můj osobní pohled na graf, napsaný dřív, než je známý výsledek. Nejde o investiční doporučení.