What I see
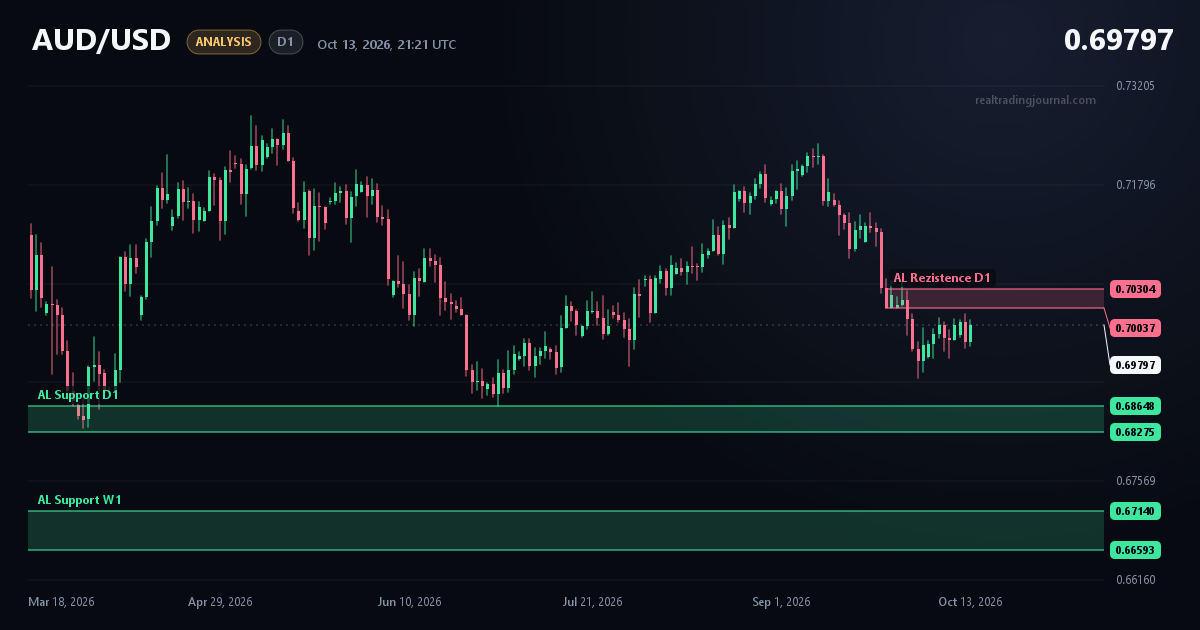
AUD/USD is trading at 0.69797 on the D1 chart after a downward move from the September highs. The latest candles form a small consolidation right below my daily resistance.
Key levels
- D1 resistance: 0.70037–0.70304
- D1 support: 0.68648–0.68275
- W1 support: 0.67140–0.66593
Price is close to the lower edge of the resistance, so this zone is the most important one for me right now.
My plan
If price reaches the resistance zone at 0.70037–0.70304, I am ready to go short. The first area I will watch as a possible target is the D1 support around 0.68648.
The USD has important economic news today. I have to wait for the results and decide, based on how the market reacts, whether I enter the trade or not. Until price reaches the zone and the news is digested, I am not entering.