What I see
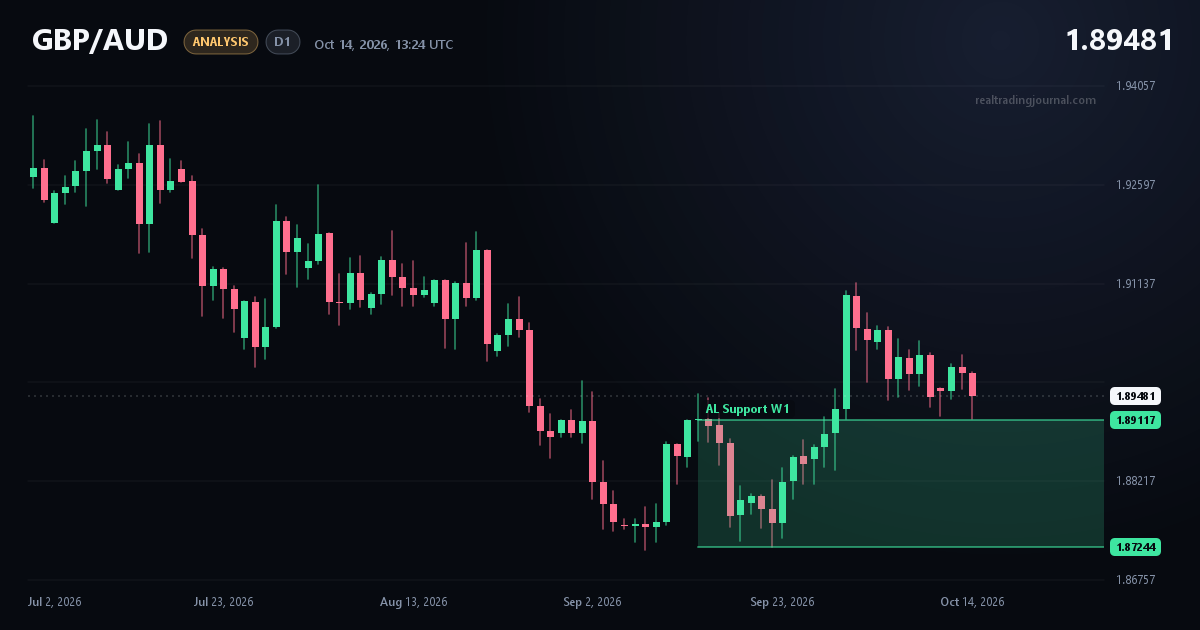
On the daily chart, GBP/AUD is retracing after a strong impulse up from the W1 support zone. The pullback is roughly 50% of the prior move. The current price of 1.89481 is holding just above the top of the highlighted zone.
Key levels
- W1 support zone: 1.87244 – 1.89117
- Considered entry: about 1.8930
- Stop loss (SL): 1.8840
- Take profit (TP1): 1.9190
My plan
If price comes back to the area around 1.8930 and holds above the support zone, I'm considering a long. I would place my SL at 1.8840, below the entry area, with the first target at 1.9190.
If price drops below 1.8840, the long idea no longer holds for me and I will reassess the pullback. I'm not rushing the entry and want to see how price reacts at the level.