What I see
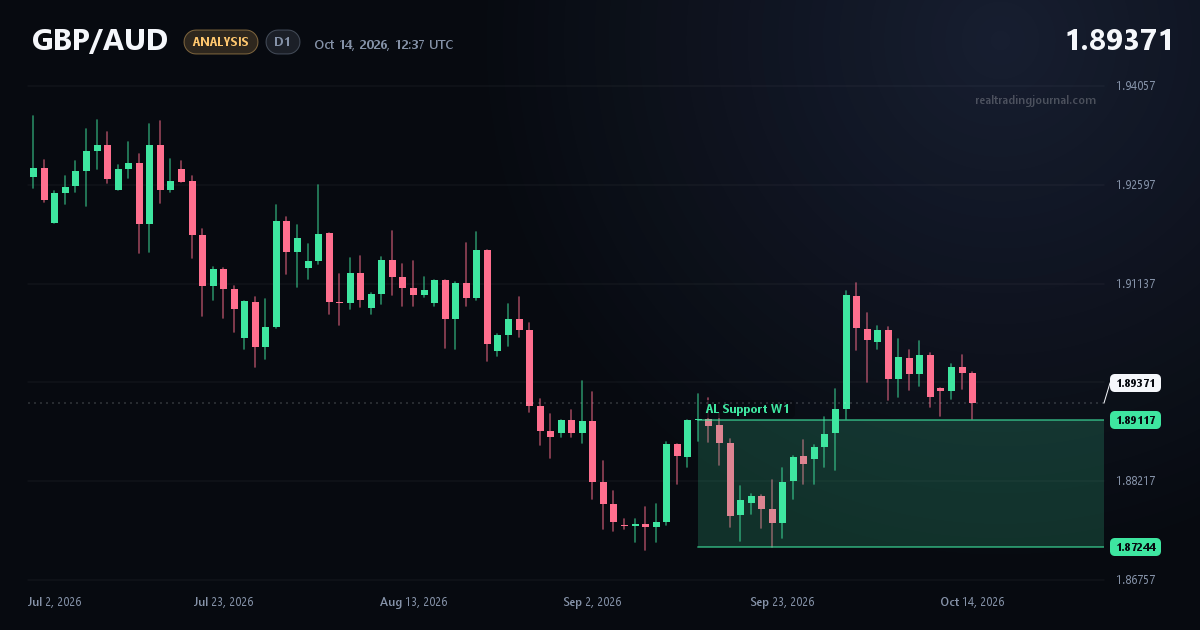
After a sharp rally off support, price on the D1 is retracing. The pullback is now deeper, roughly 50 percent of the prior move. Price is at 1.89371, just above the upper edge of the zone I marked as AL Support W1.
Key levels
- Upper edge of the AL Support W1 zone: 1.89117
- Lower edge of the zone: 1.87244
The zone comes from the area where price turned and moved higher in late September. That is why I treat it as a place to look for a reaction from buyers.
My plan
I'm considering repeating the buy trade. First, I want to see how price behaves when it tests the upper edge of the zone around 1.89117. If I see a reaction and rejection of lower prices there, I will look for an entry in line with the original trade.
If price closes a daily candle below the lower edge at 1.87244, the idea is invalid and I will not repeat the buy.