What I see
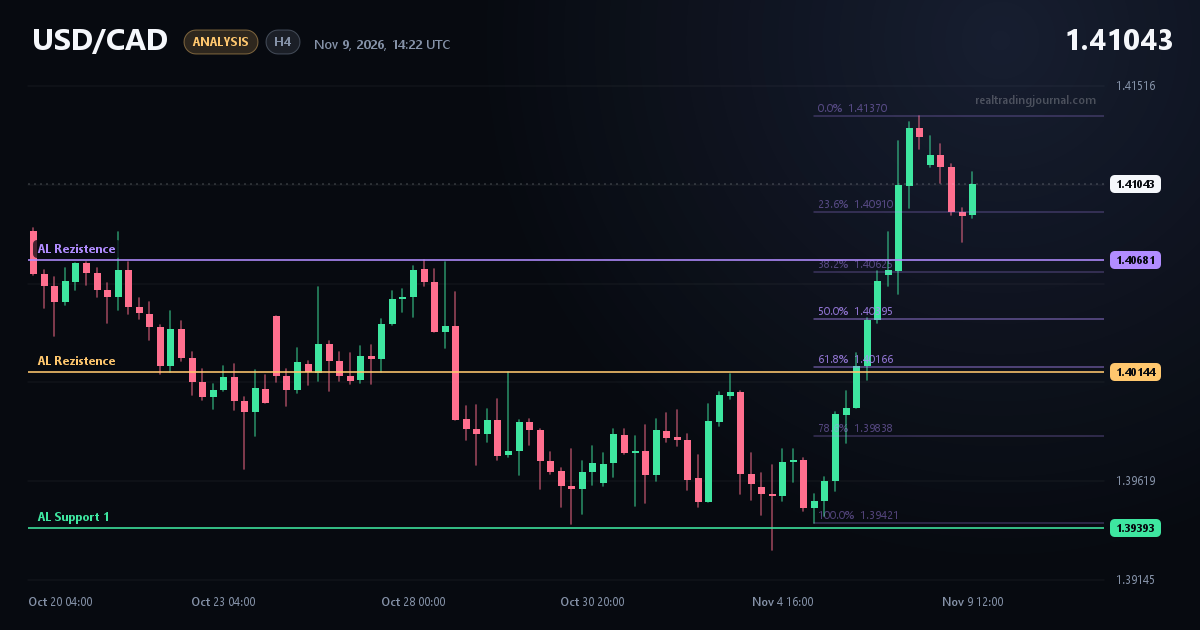
After bouncing from the low at 1.39421, USD/CAD on H4 has moved back above the resistance I have marked at 1.40681. Price reached a high of 1.4137 and is now trading around 1.41043 (Nov 9, 2026, 14:22 UTC). The resistance around 1.4070 is now behind price.
Key levels
- 1.4070 (drawn resistance at 1.40681): the broken level that may now act as support and forms the upper edge of the pullback zone
- 1.4014 (drawn resistance at 1.40144): the lower edge of the pullback zone, a former resistance
- 1.4137: the recent high, the top of my Fibonacci drawing
- 1.39421: the low price bounced from, the bottom of my Fibonacci drawing
- 1.39393: the support price bounced from
My plan
I'm not chasing the move. If price pulls back into the 1.4070 to 1.4014 zone, I will consider a long entry. This zone also matches the 38% to 61% Fibonacci levels. I want to see the zone hold as support rather than price simply slicing through it. If price doesn't return to this zone, I won't force a trade.