What I see
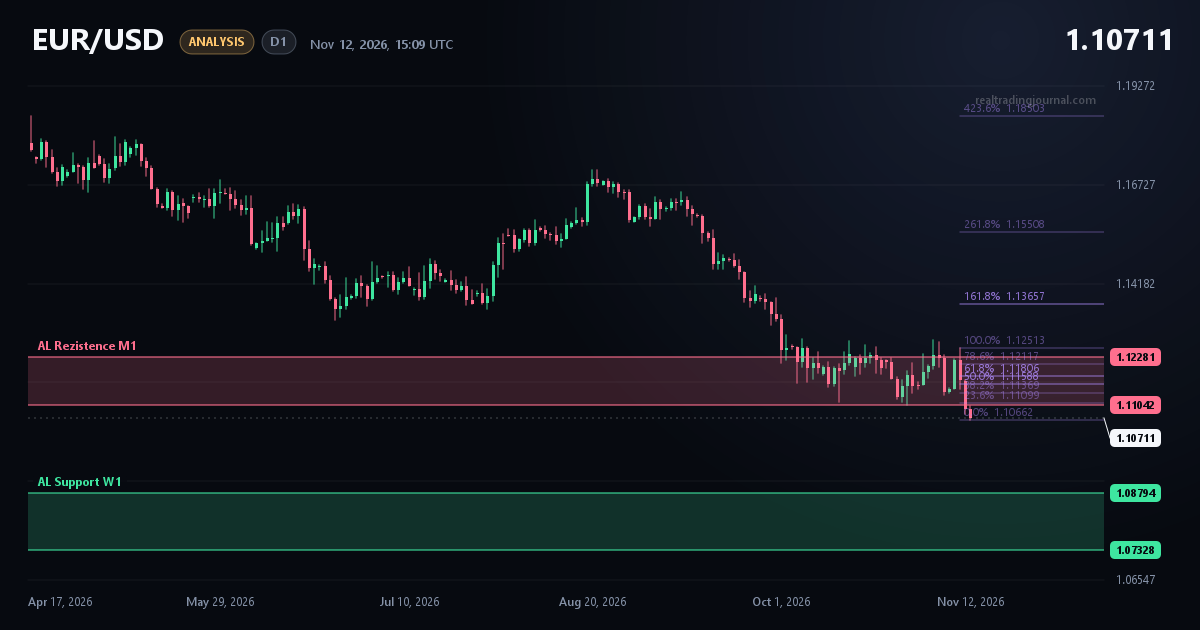
On D1, price broke down through the monthly zone at 1.11042–1.12281, which used to act as support. It is now trading at 1.10711, below the lower edge of the zone. Selling pressure is clear, and the zone is turning into resistance.
Key levels
- Monthly zone (now resistance): 1.11042–1.12281
- Weekly support zone: 1.07328–1.08794
- Fib drawing: 1.12513 and 1.10662
My plan
Price will likely continue toward the weekly support. I don't want to chase the move, though. I'll wait for a pullback to roughly 1.1130, back into the broken zone, and look for a short entry there.
If price holds below the zone after the pullback, my first target is the upper edge of the weekly support at 1.08794. A return above the top of the zone at 1.12281 would significantly weaken my view.